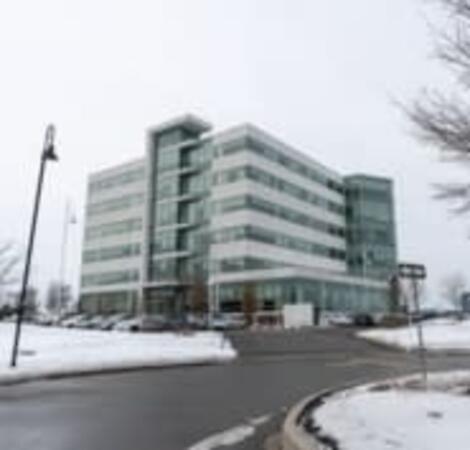
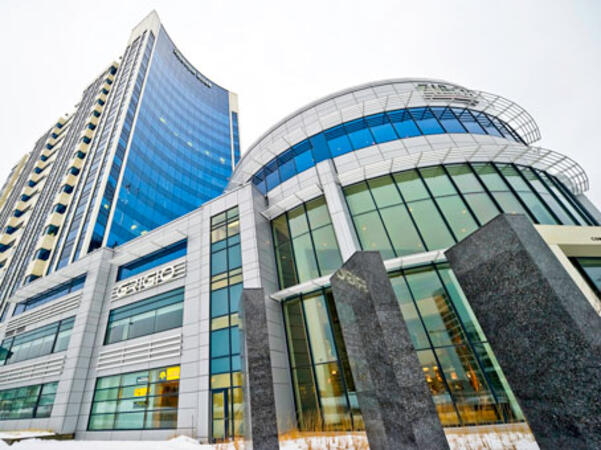
1250 Rene Levesque Boulevard West, Montreal, Canada, H3B 4W8
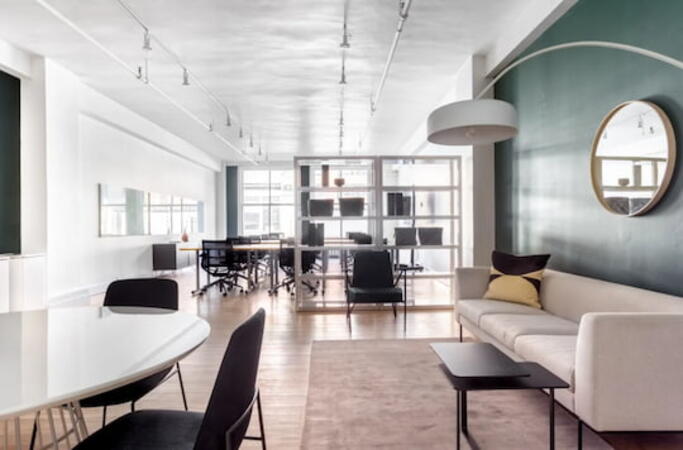
Montreal - Rene Levesque
Saint Laurent- Dr. Frederik-Philips
1111 Dr. Frederik-Philips Boulevard, Saint Laurent, Canada, H4M 2X6
Laval - Daniel Johnson Boulevard
2572 Daniel-Johnson Boulevard, Laval, Canada, H7T 2R3
Pointe Claire - Transcanada
6500 TransCanada Service Road, Pointe Claire, Canada, H9R 0A5
Brossard - Complexe Dix 30
1040 Lux Street # 410, Brossard, Canada, J4Y 0E3
Levis - de Courchevel Street
1190B de Courchevel Street, Levis, Canada, G6W 0M6
Montreal - University Street
2001 Blvd. Robert Bourassa, Montreal, Canada, H3A 2A6
Quebec - Sainte Foy
2828 Boulevard Laurier, Suite 700, Quebec City, Canada, G1V 0B9
Gatineau - Montcalm Street
200 Montcalm Street, Gatineau , Canada, J8Y 3B5
Québec-Lebourgneuf Business Centre
Suite 400, Rue de la Couronne, Québec, Canada, G1K 6P4
Quebec City - Complexe Jules Dallaire
2828 Boulevard Laurier, Quebec City, Canada, G1V 0B9
Subcategories (8)
Explore Our Courses
Storytelling with Data
14 HoursIntroduction to dbt Cloud
21 HoursArcGIS from Basic to Advanced
35 HoursAWS Glue Fundamentals
14 HoursGoogle Gemini AI for Data Analysis
21 HoursIBM Planning Analytics (TM1)
21 HoursAzure Synapse Analytics
14 HoursAnalytic Functions Fundamentals
21 HoursArcGIS Fundamentals
14 HoursArcMap in ArcGIS
14 HoursBig Data and Advanced Analytics
42 HoursSPSS Modeler
14 HoursData Analytics With R
21 HoursExcel For Statistical Data Analysis
14 HoursIBM Cloud Pak for Data
14 HoursPython for Excel
14 HoursAzure for Data Engineer
35 HoursPython for Data Analysis
21 HoursSQL Advanced level for Analysts
21 HoursArcGIS for Spatial Analysis
14 HoursArcGIS Pro for Spatial Analysis
14 HoursArcGIS with Python Scripting
14 HoursData Cleaning
7 HoursLibreOffice Calc for Data Analysis
14 HoursIntroduction to Spotfire
14 HoursLast Updated:
Testimonials (16)
the practical part
Daniela Mirevska
Course - Business Process Modelling in BPMN 2.0
We did quite complex examples, so we could get a feeling of how the real work with Power Automate Desktop can look like in the real world scenario.
Michal Strnad - MicroNova AG
Course - Microsoft Flow/Power Automate
Smart work reporting criteria
Siyabonga Kubeka - NTCSA
Course - Power BI for Business Analysts
The teacher clarification of the teacher about the subjects
Josildo Zangue - EMIS - Empresa Interbancaria de Servicos, S.A
Course - Business Analysis
hands on exercise
shuzhen hong
Course - AI-Driven Data Analysis with TIBCO Spotfire X
What I like the most about the training was the detailed discussion and the Exercises.
Kevin Roi Rimpos - Century Pacific Food Inc.
Course - Business Process Re-engineering for Competitive Advantage
It felt very well paced and Yashank was a great trainer!
Rebekah Kane - OVO
Course - Mixpanel
The trainer shared his knowledge and led great atmosphere.
Agnieszka Dubanska - Narodowy Fundusz Zdrowia
Course - Modelowanie procesów biznesowych z wykorzystaniem UML i BPMN
information about report, kind of costs, details about that in accounting
Konrad Nowak - Solvti Sp. z o. o.
Course - Business Intelligence Reporting Tool (BIRT)
The explanations and interactivity of the trainer, he really brought the subject well; and even-though I was probably not experienced enough, I did learn a lot from it!
Pieter Bruynseels - Spot Buy Center BV
Course - Design Patterns
Flow , vibe and topic on presentation
Lukasz Kowalczyk - Allegro Sp. z o.o.
Course - Google Gemini AI for Data Analysis
Doing Exercise
Joe Pang - Lands Department, Hong Kong
Course - QGIS for Geographic Information System
a multitude of points
Joanna - Instytut Ekonomiki Rolnictwa i Gospodarki Zywnosciowej-PIB
Course - Statistical Analysis with Stata and R
training vibes, trainer knowledge, and insightful materials
Rizma Aulia Rachman - Lembaga Penjamin Simpanan
Course - Big Data and AI in Connection to Bank Examination Process
The training was well adapted to my needs, with an exercise on the second day involving the creation of a dashboard for which I was able to propose and send the data and layout myself.
Agathe - Audap
Course - Python with Plotly and Dash
Machine Translated
- Building dashboards - Learning the counts and SUMs and SWITCH -